Dashboards
Our dashboards are purpose built, visually engaging, and analytically powerful. Make faster, more informed decisions, when it matters.
Empowering decision-makers
We empower organisations and decision-makers to monitor performance and discover opportunities hidden in their data through our bespoke, engaging and powerful dashboard software.

Purpose built for your organisation
We build dashboards to your objectives, requirements and style guide. Exactly the way you want. No compromises, software limitations, self-service tools, or ongoing licensing fees.
All your reporting in one place
Combine and analyse market research surveys, sales, inventory, advertising, human resource and other data in one dashboard. Access anywhere, anytime, on any device.

Powerful visuals and analytics
Present your data and insights in a beautiful dashboard featuring premium graphic design, interactive data visualisations, complex metrics, and dynamic filtering capability.
Dashboard features
We offer a suite of features that are only available through bespoke dashboard builds.
We do it all for you
We build your dashboard from start to finish, meaning you never have to use DIY dashboard tools, attend training, or hire external consultants.
Combine your data
Create a centralised database and link your data sources so you can perform analysis across them for unprecedented insight.
Easy data preparation
Our analysts can clean & format any data source, so it can be imported into your dashboard reporting software with just a few clicks.
Custom visualisation
We work collaboratively with you to design custom data visualisations that reflect your business reporting needs and deliver real insight.
Various chart types
Allow users to interact with predefined static charts or make their own custom charts using any variable in your data files.
PDF, XLS, PPT export
Dashboard charts and entire pages can be exported to PDF, Excel or PowerPoint formats. Easily add data to presentations or reports.
Powerful analytics
Build complex metrics, computed variables, weighting, dynamic filters, stat testing and many other features so you can easily analyse your data.
Sample weighting
Unlike off the shelf packages, we can easily apply post-fieldwork sample weighting to ensure representativeness of a broader population.
User access tiers
Show unique data aggregations and visualisations for each user login, based on your organisation's unique hierarchy or structure.
Automated alerts
Set up automated notifications that let you know when changes occur within your data, so you can act quickly and decisively.
Browser access
Our dashboards are browser based, meaning you can access your solution anytime, anywhere, from any device with an internet connection.
High grade security
Our dashboards are secured using the highest grade encryption software for complete peace of mind. We work with clients to audit regularly.
Dashboard example
While most of our dashboards are private, we have completed a small number of publicly accessible projects. One of our favourites is the Australian Digital Inclusion Index (ADII). Read the case study here or click the button below to explore the live dashboard.
Australian Digital Inclusion Index
CSI, ADM+S, RMIT, Swinburne, and Telstra.

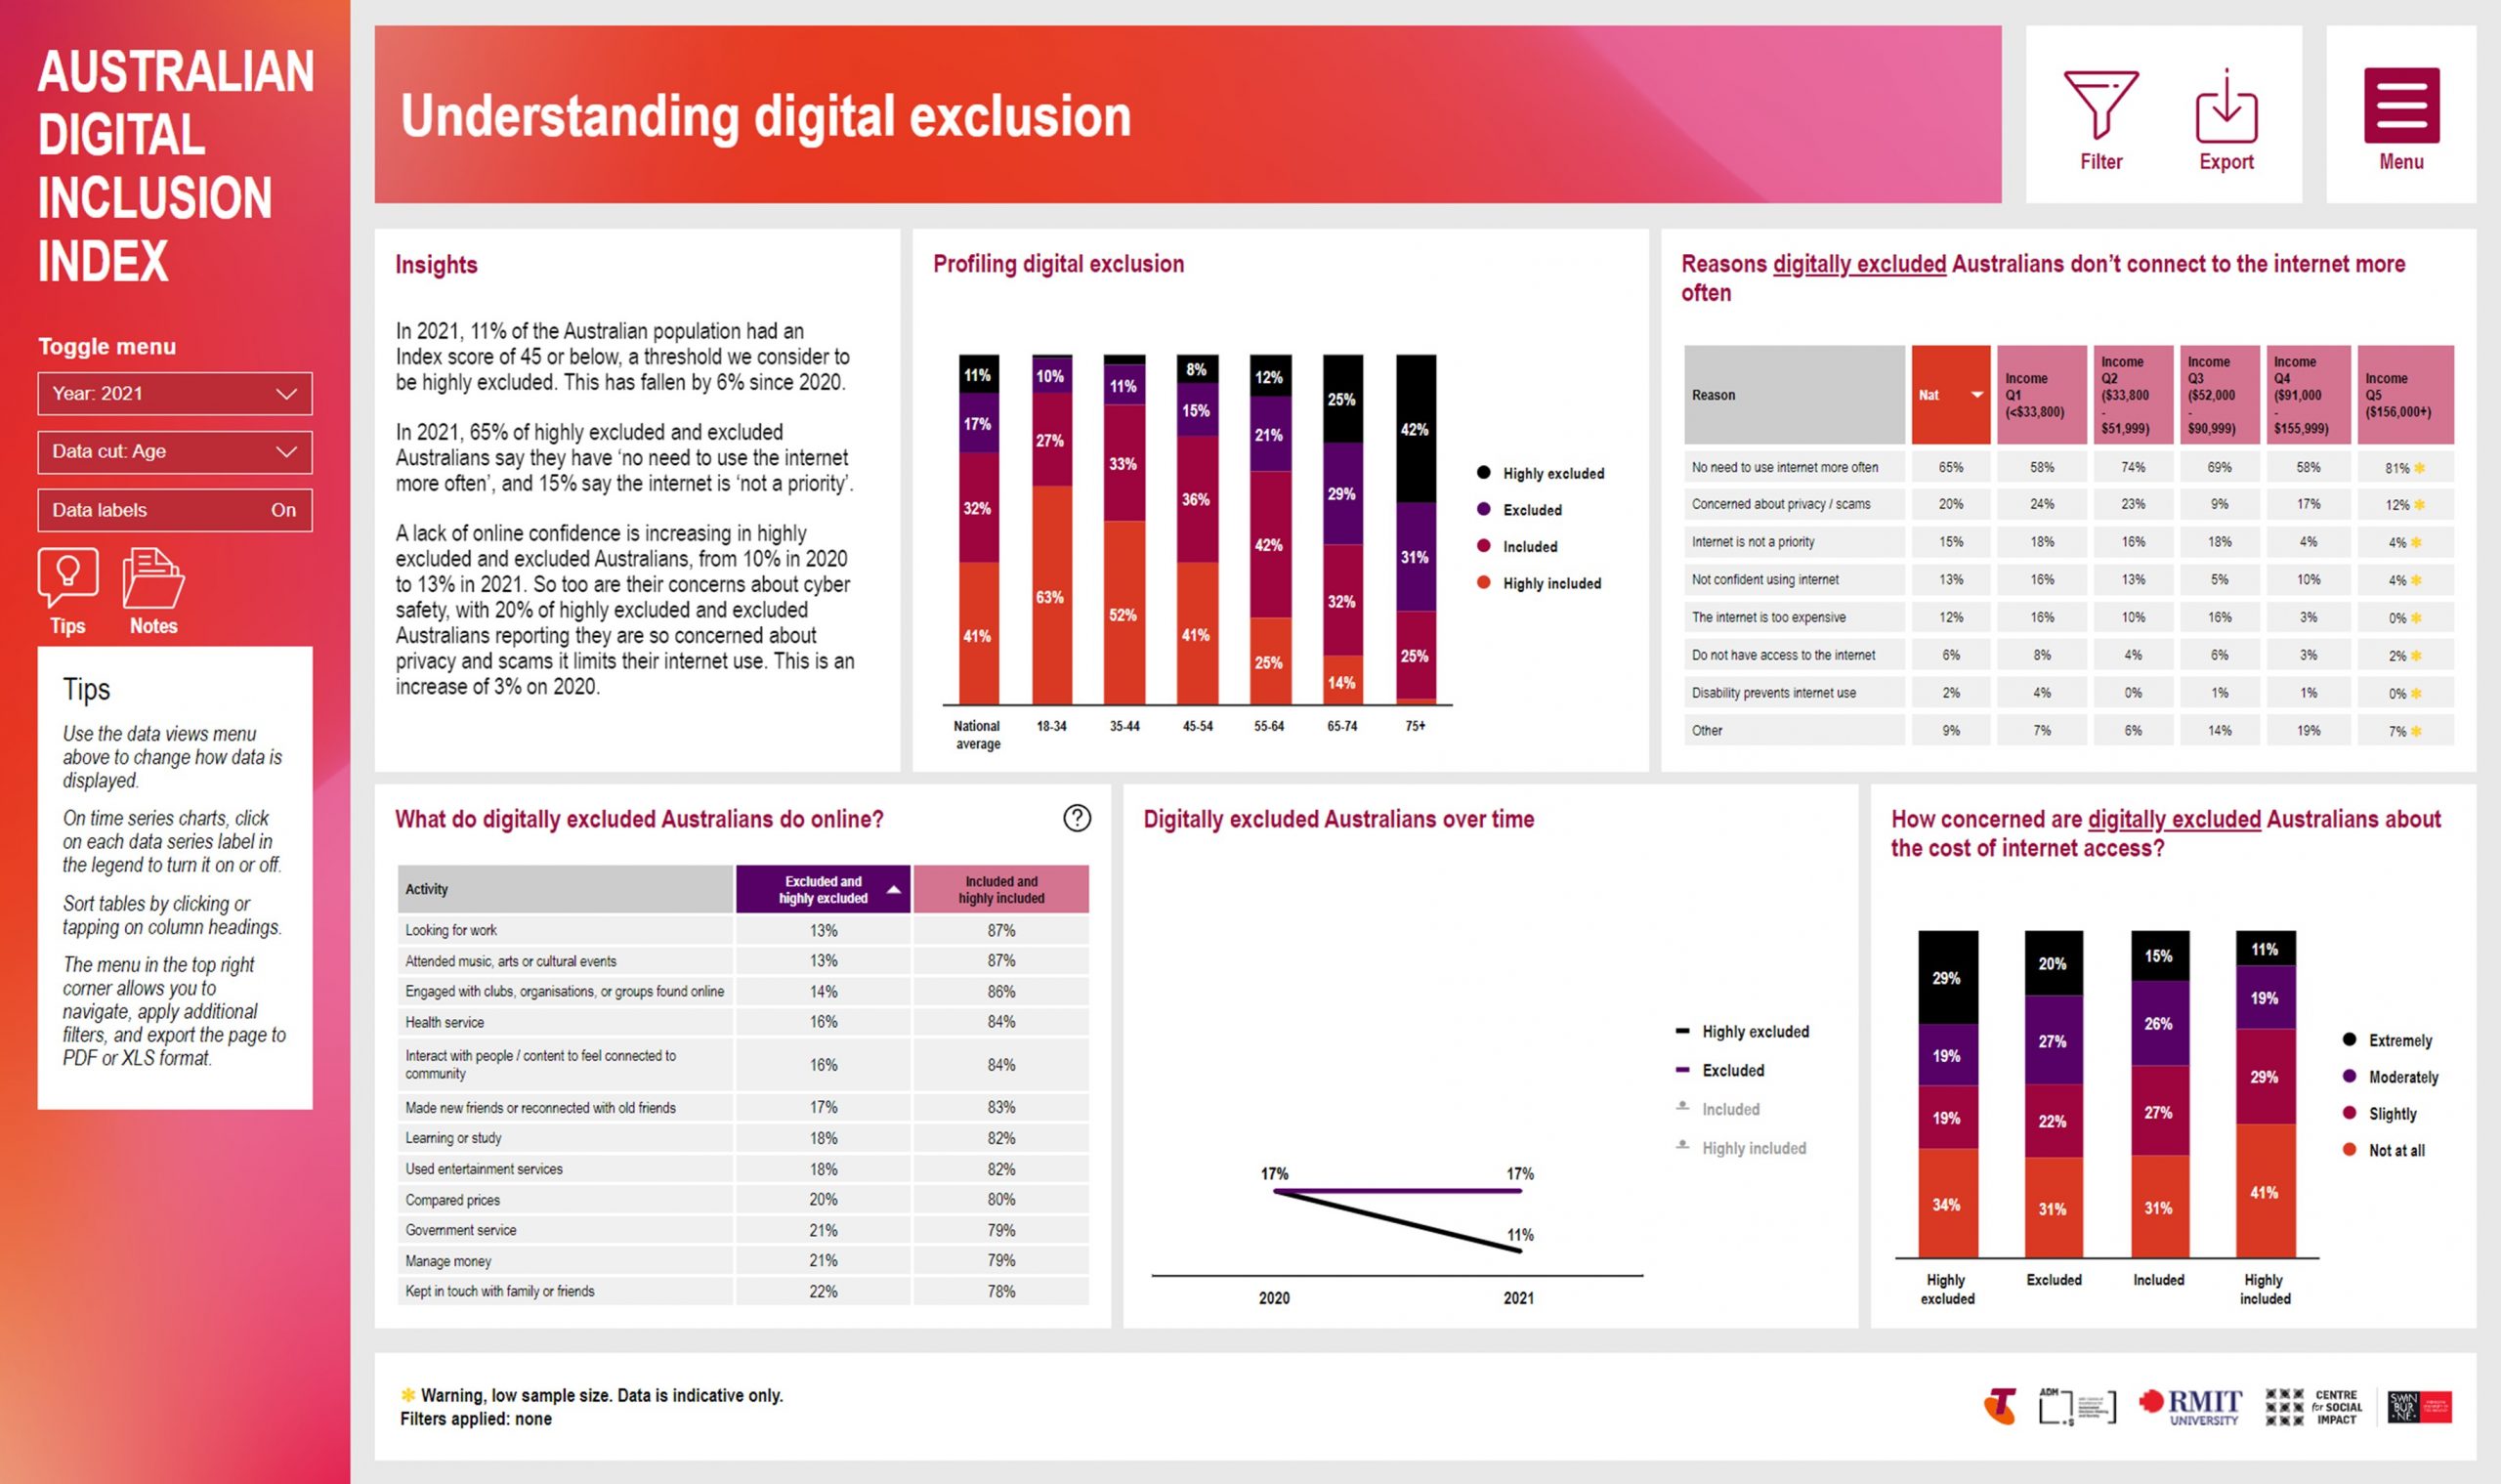
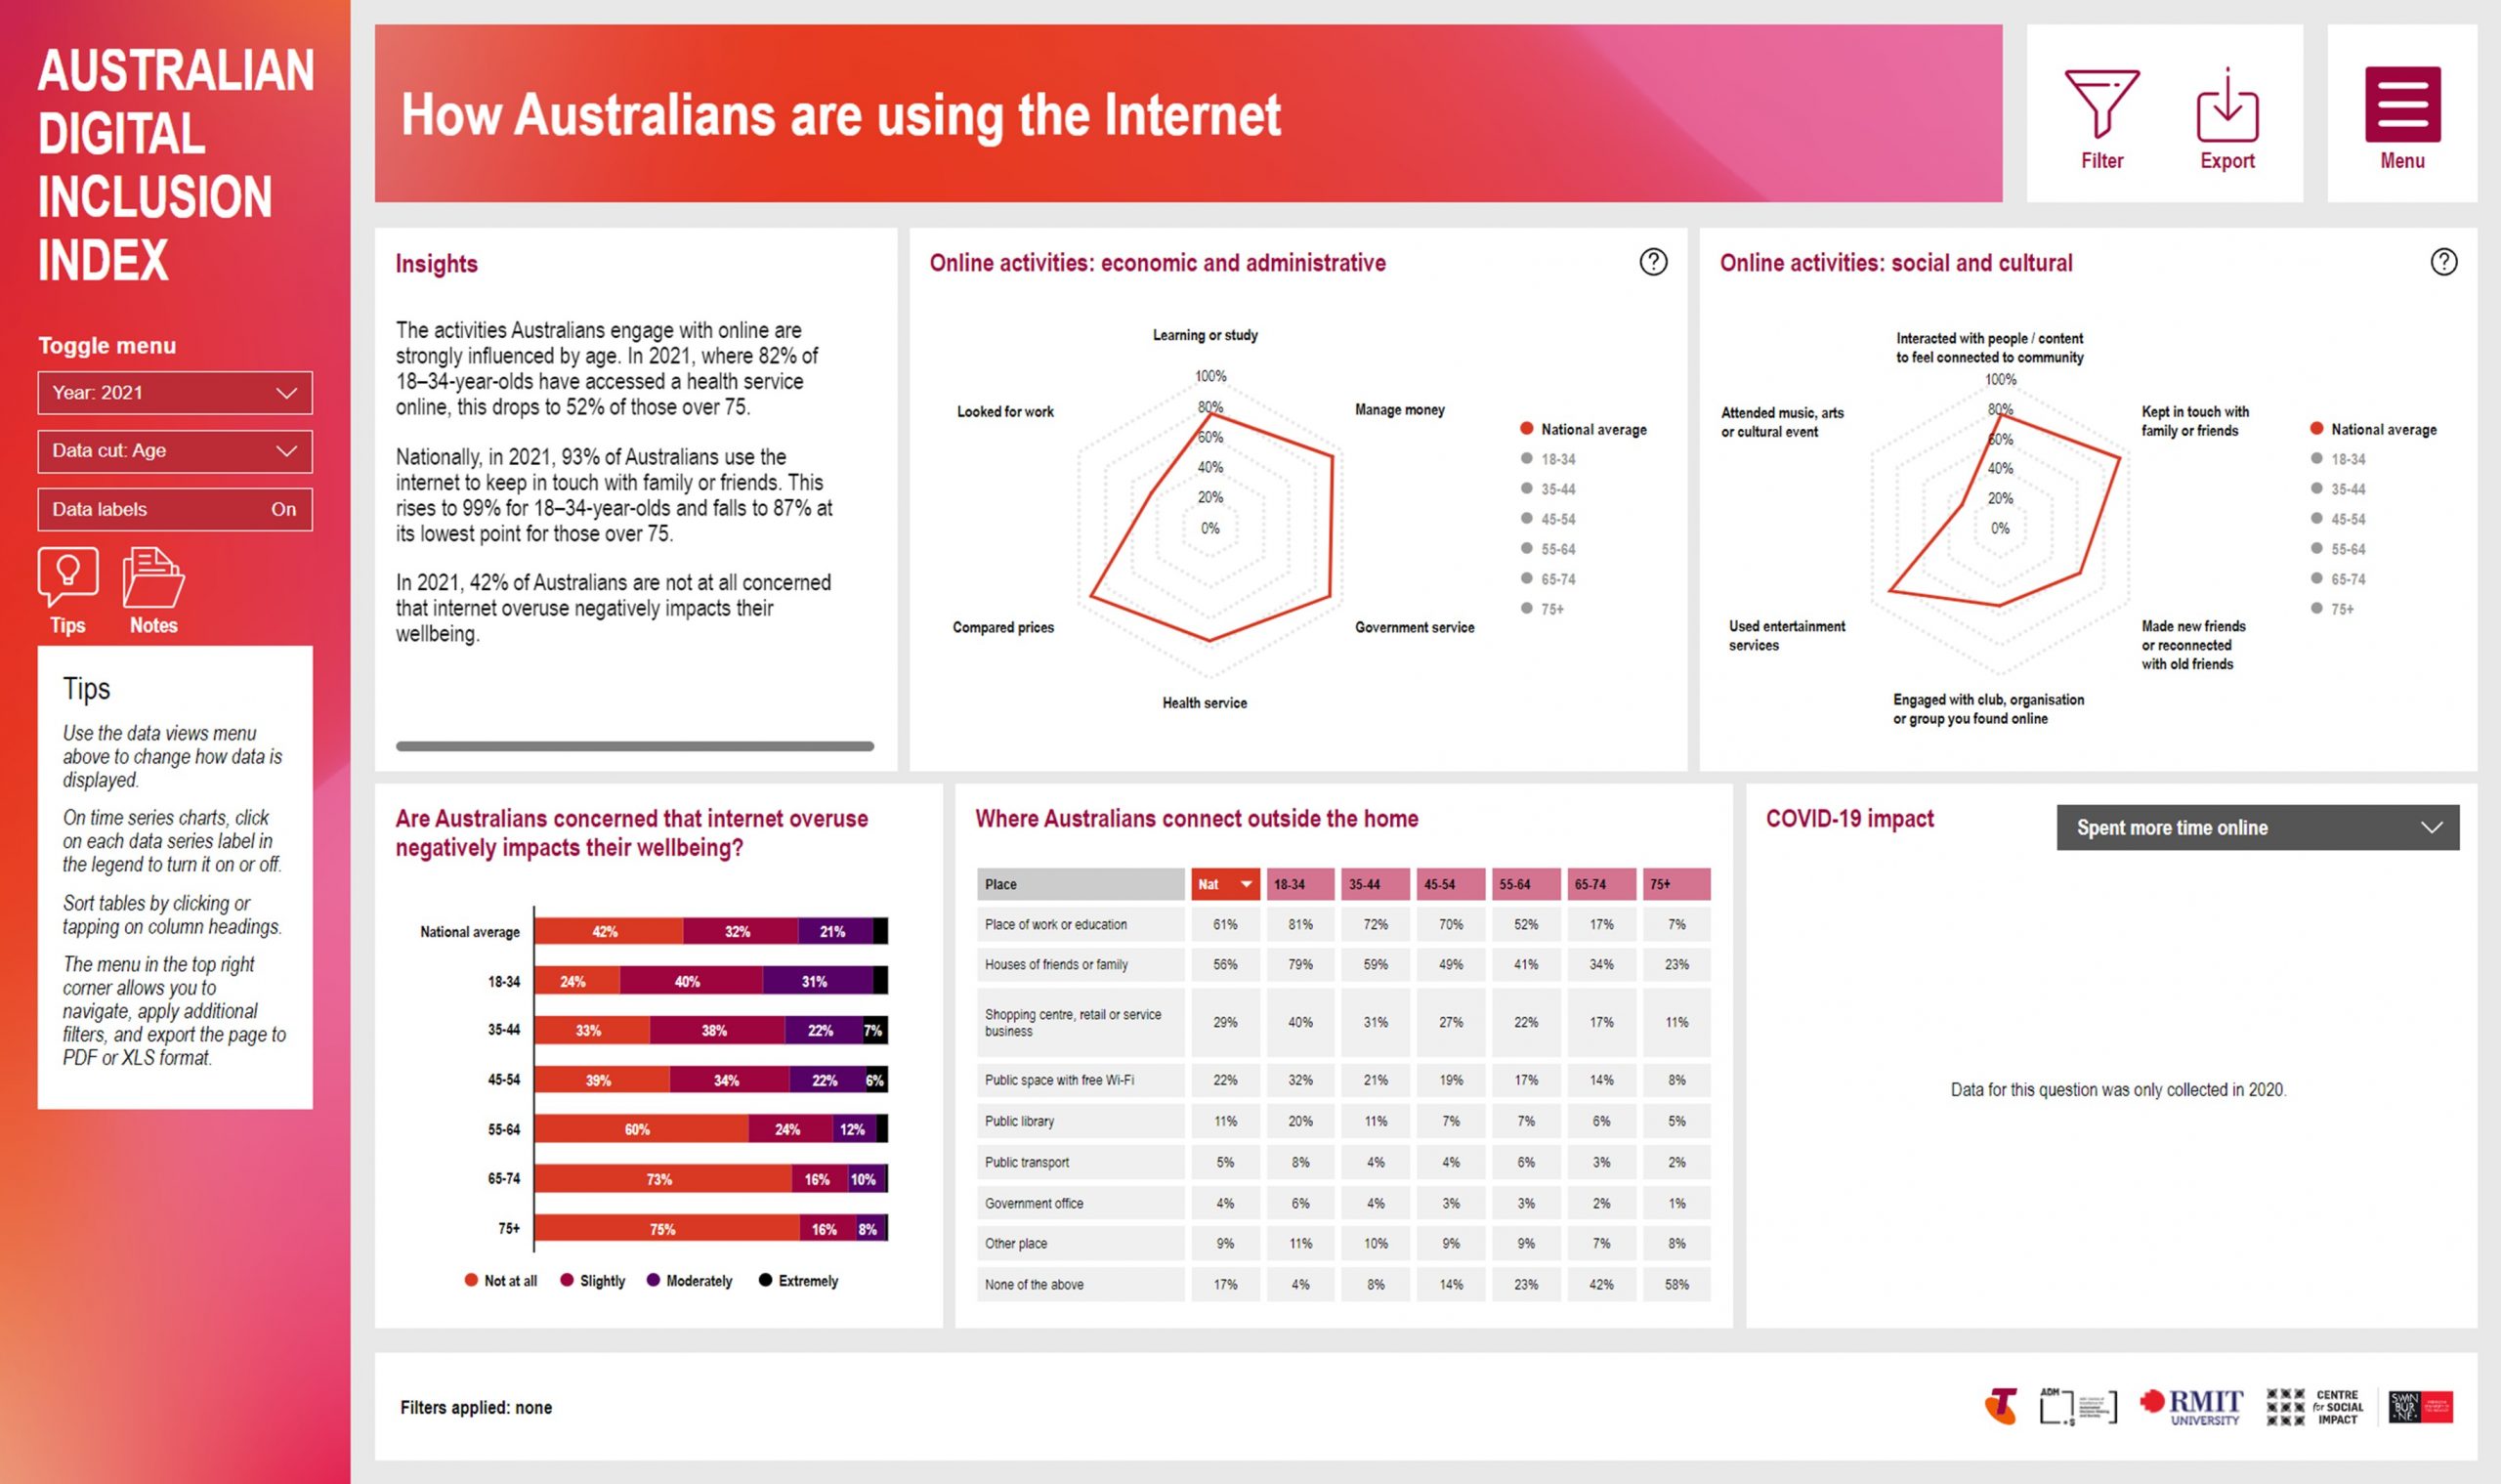
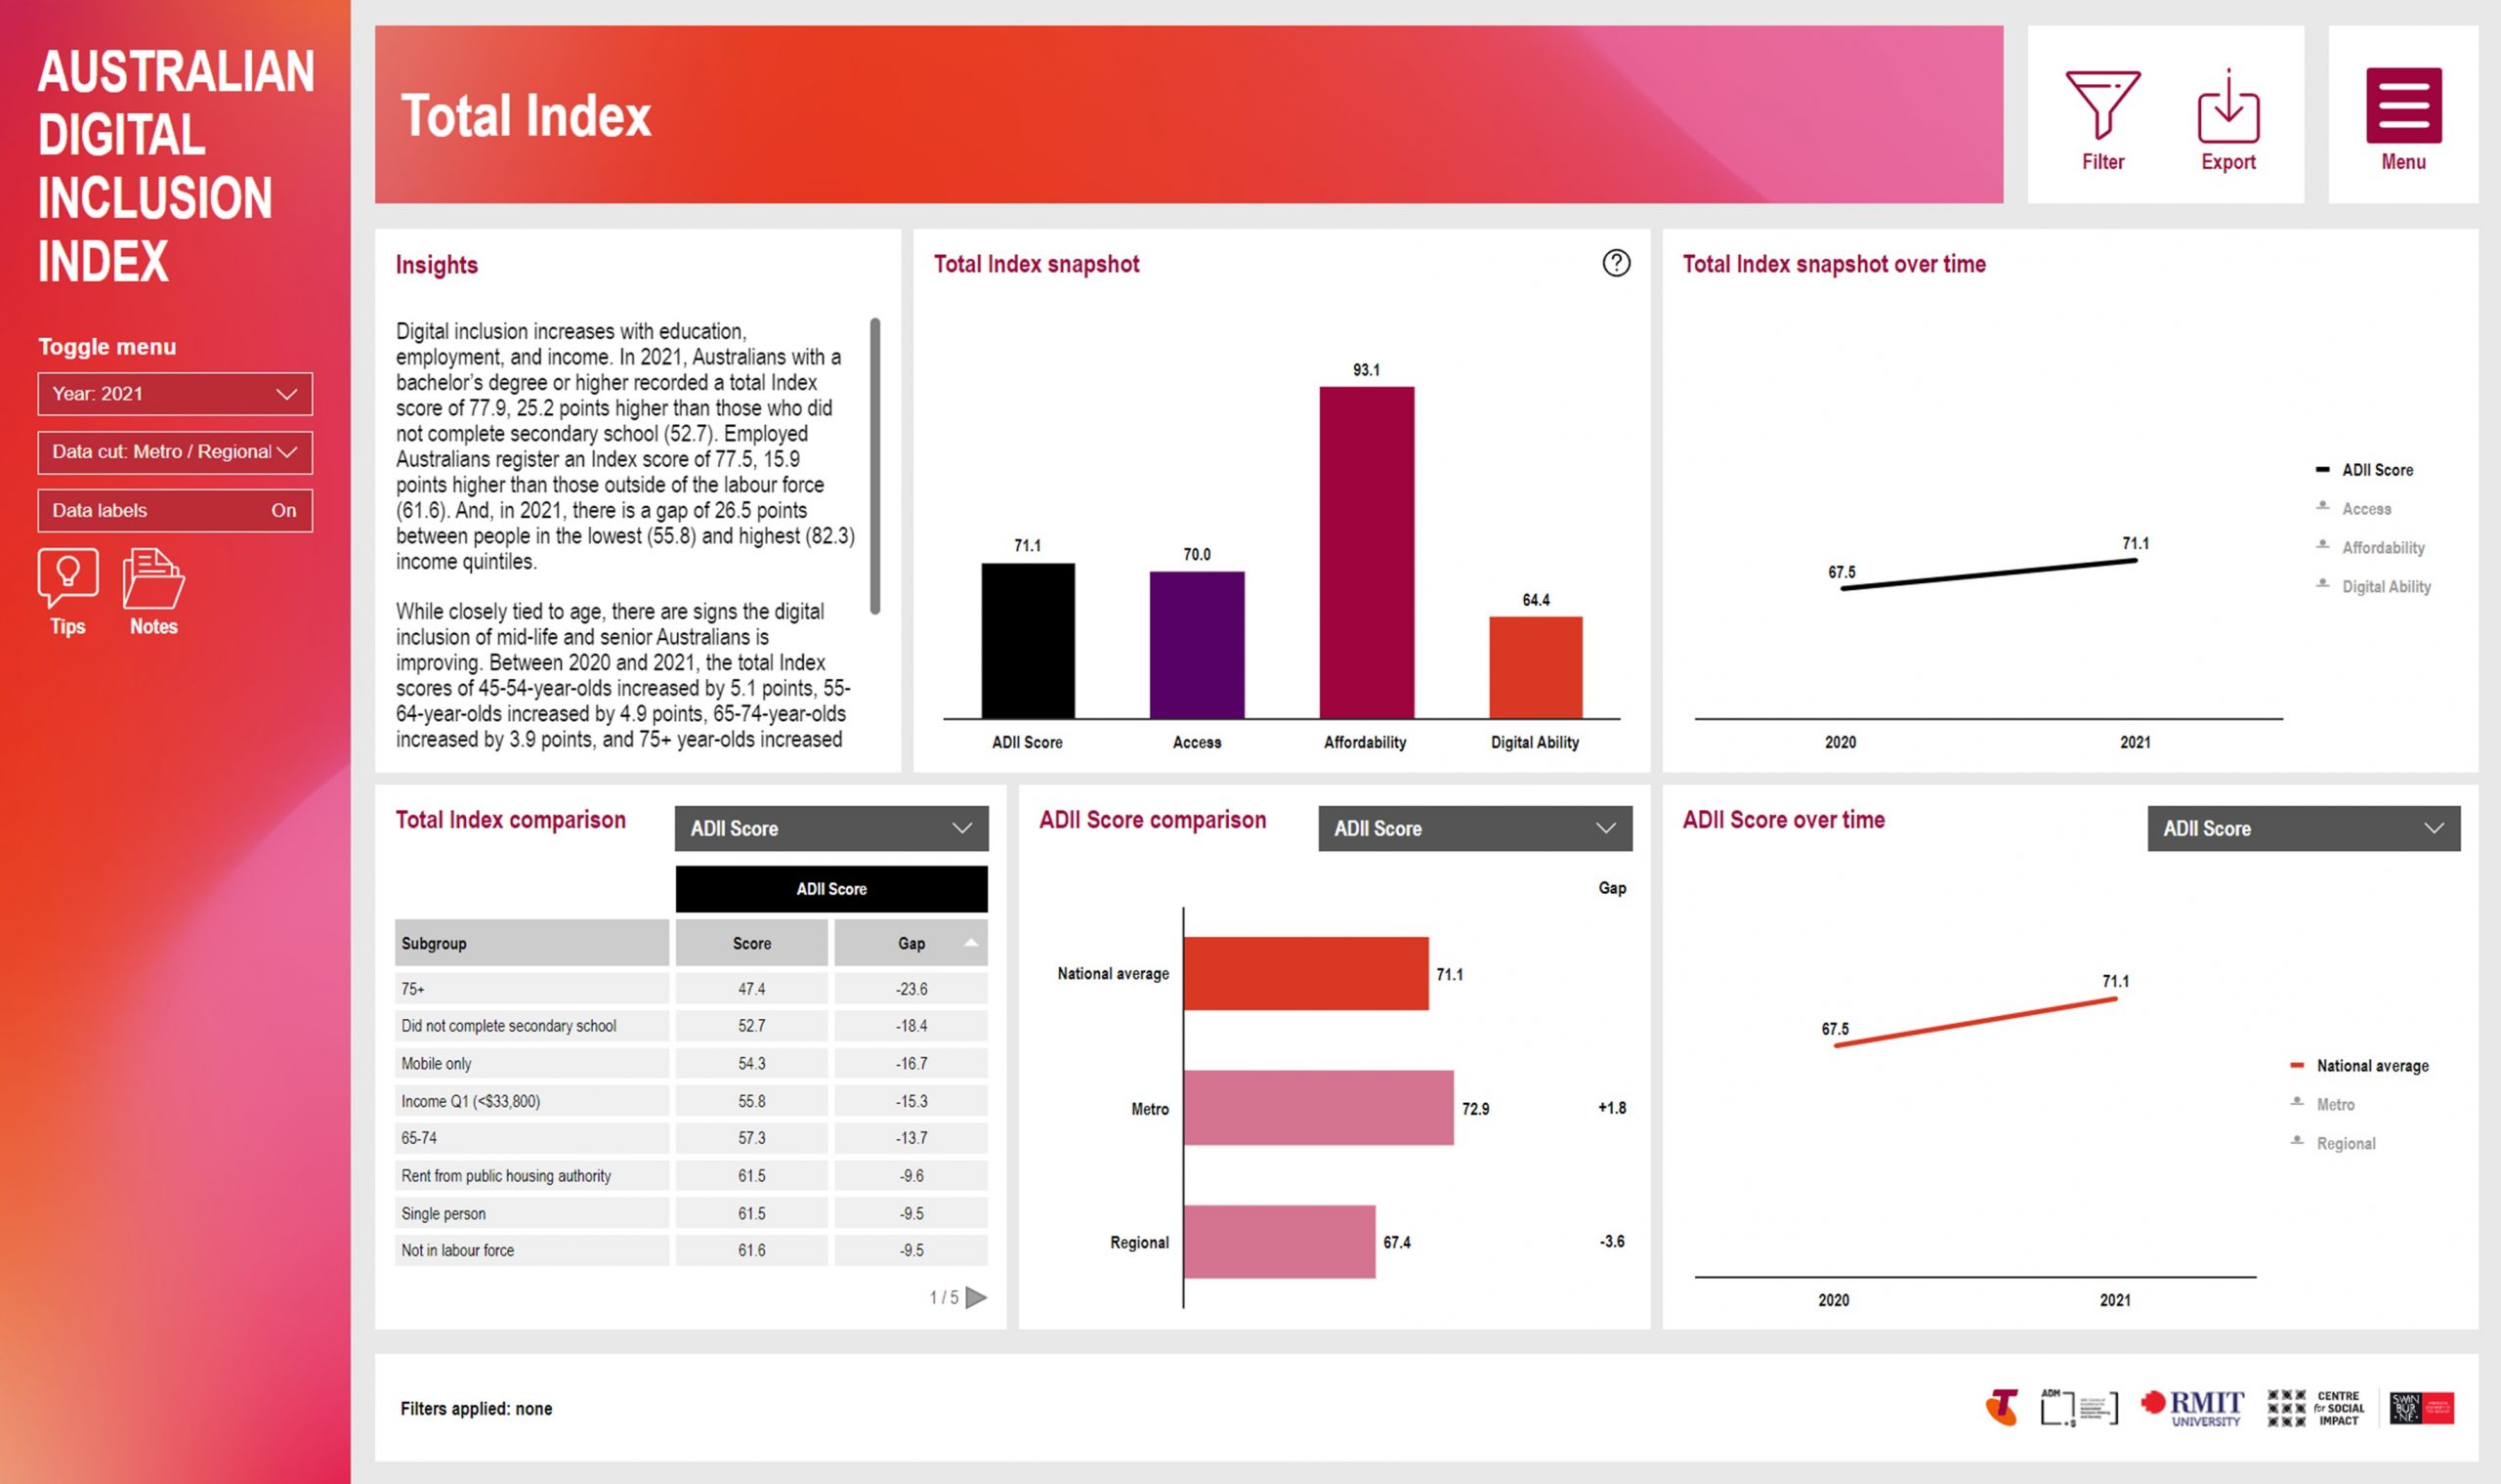
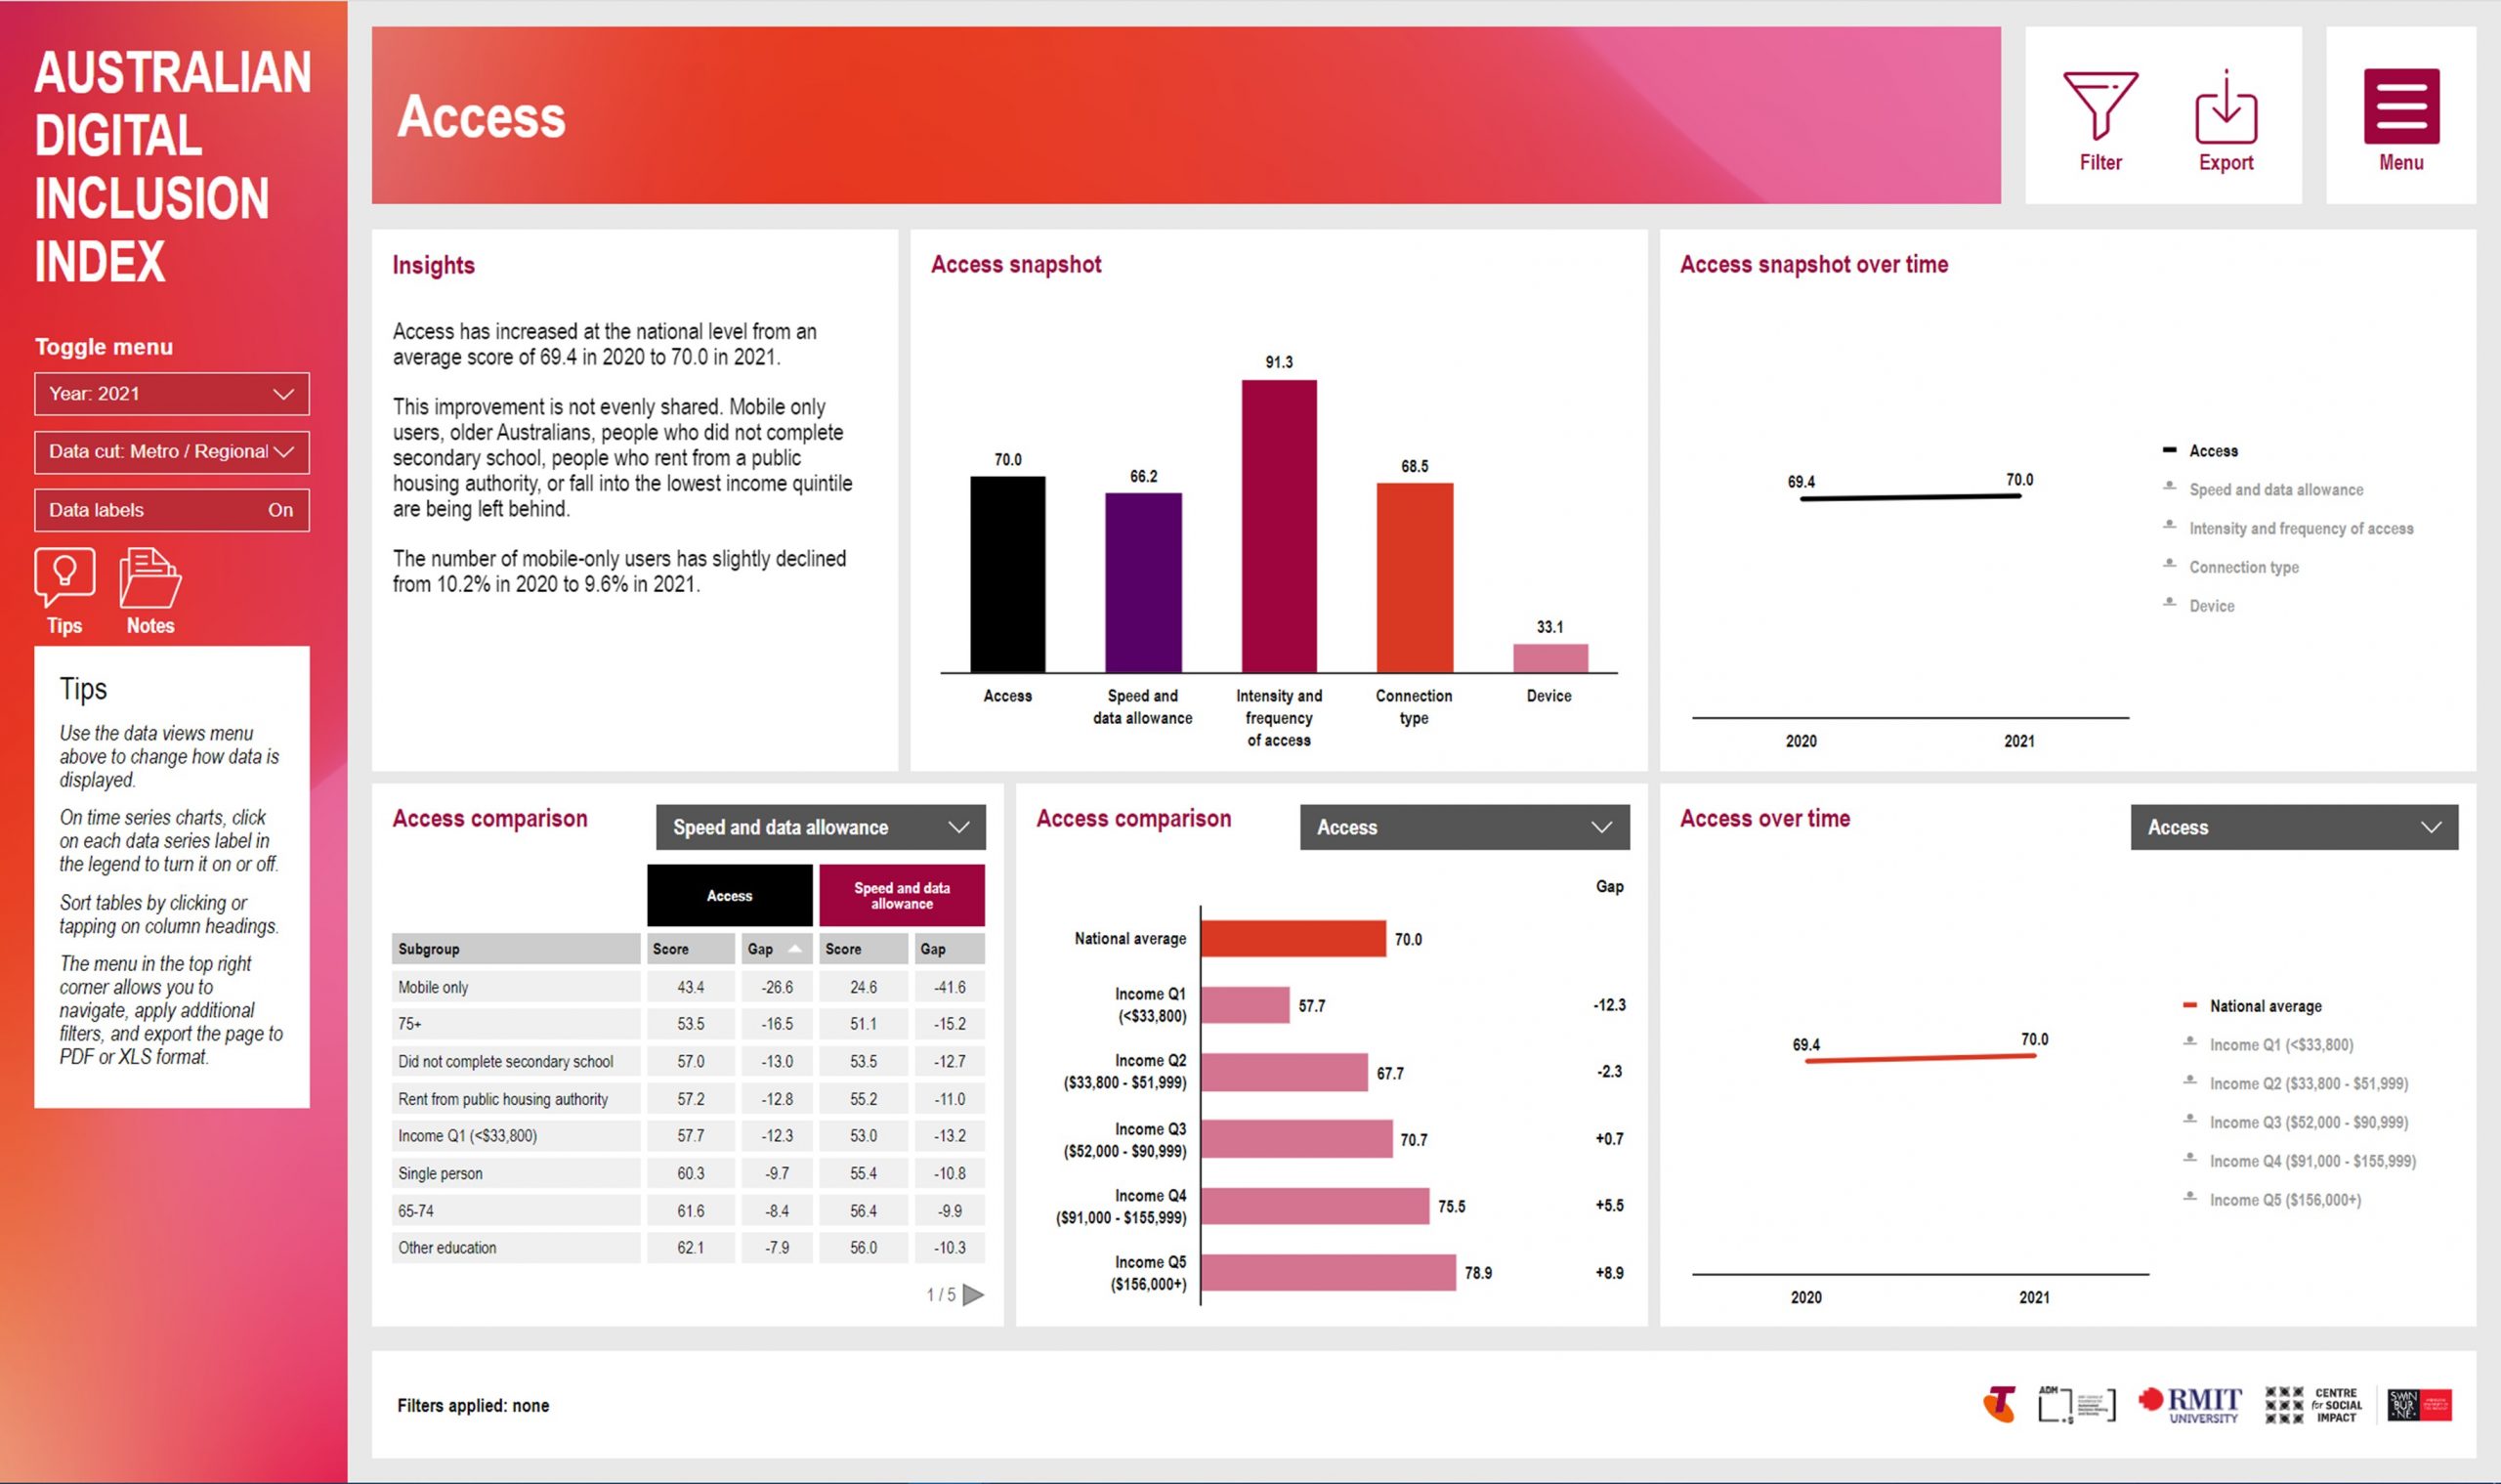
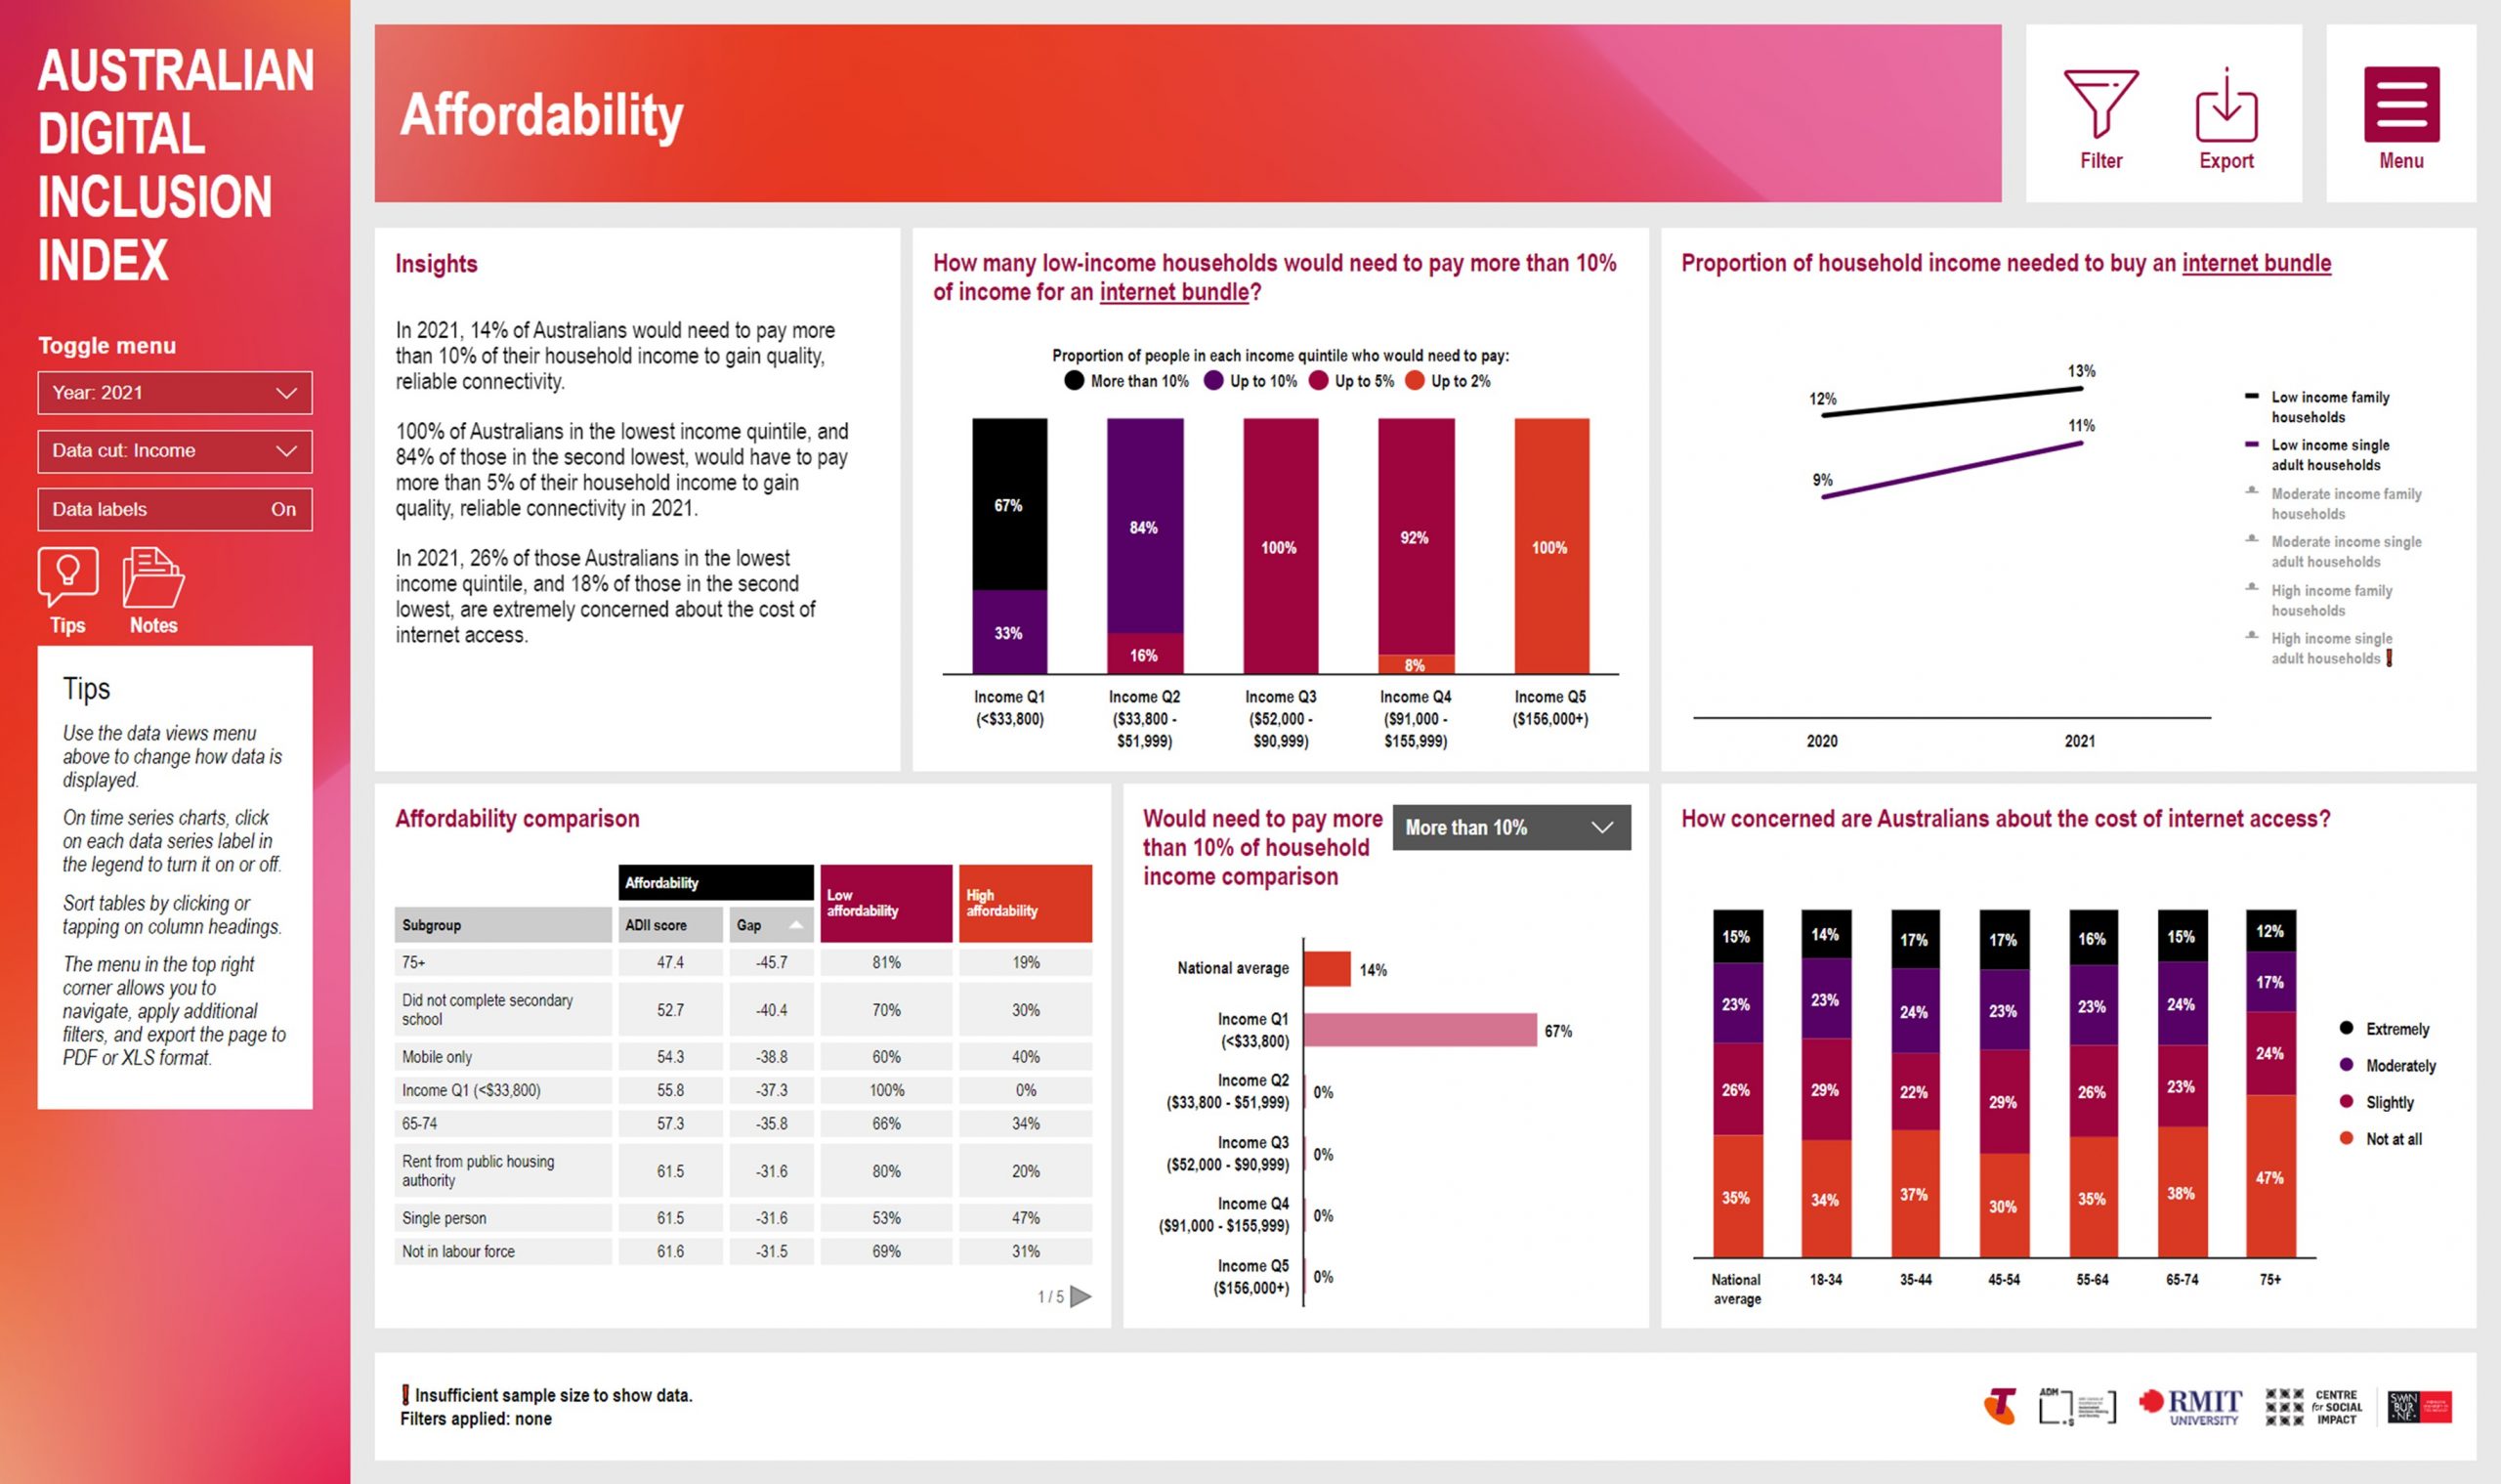
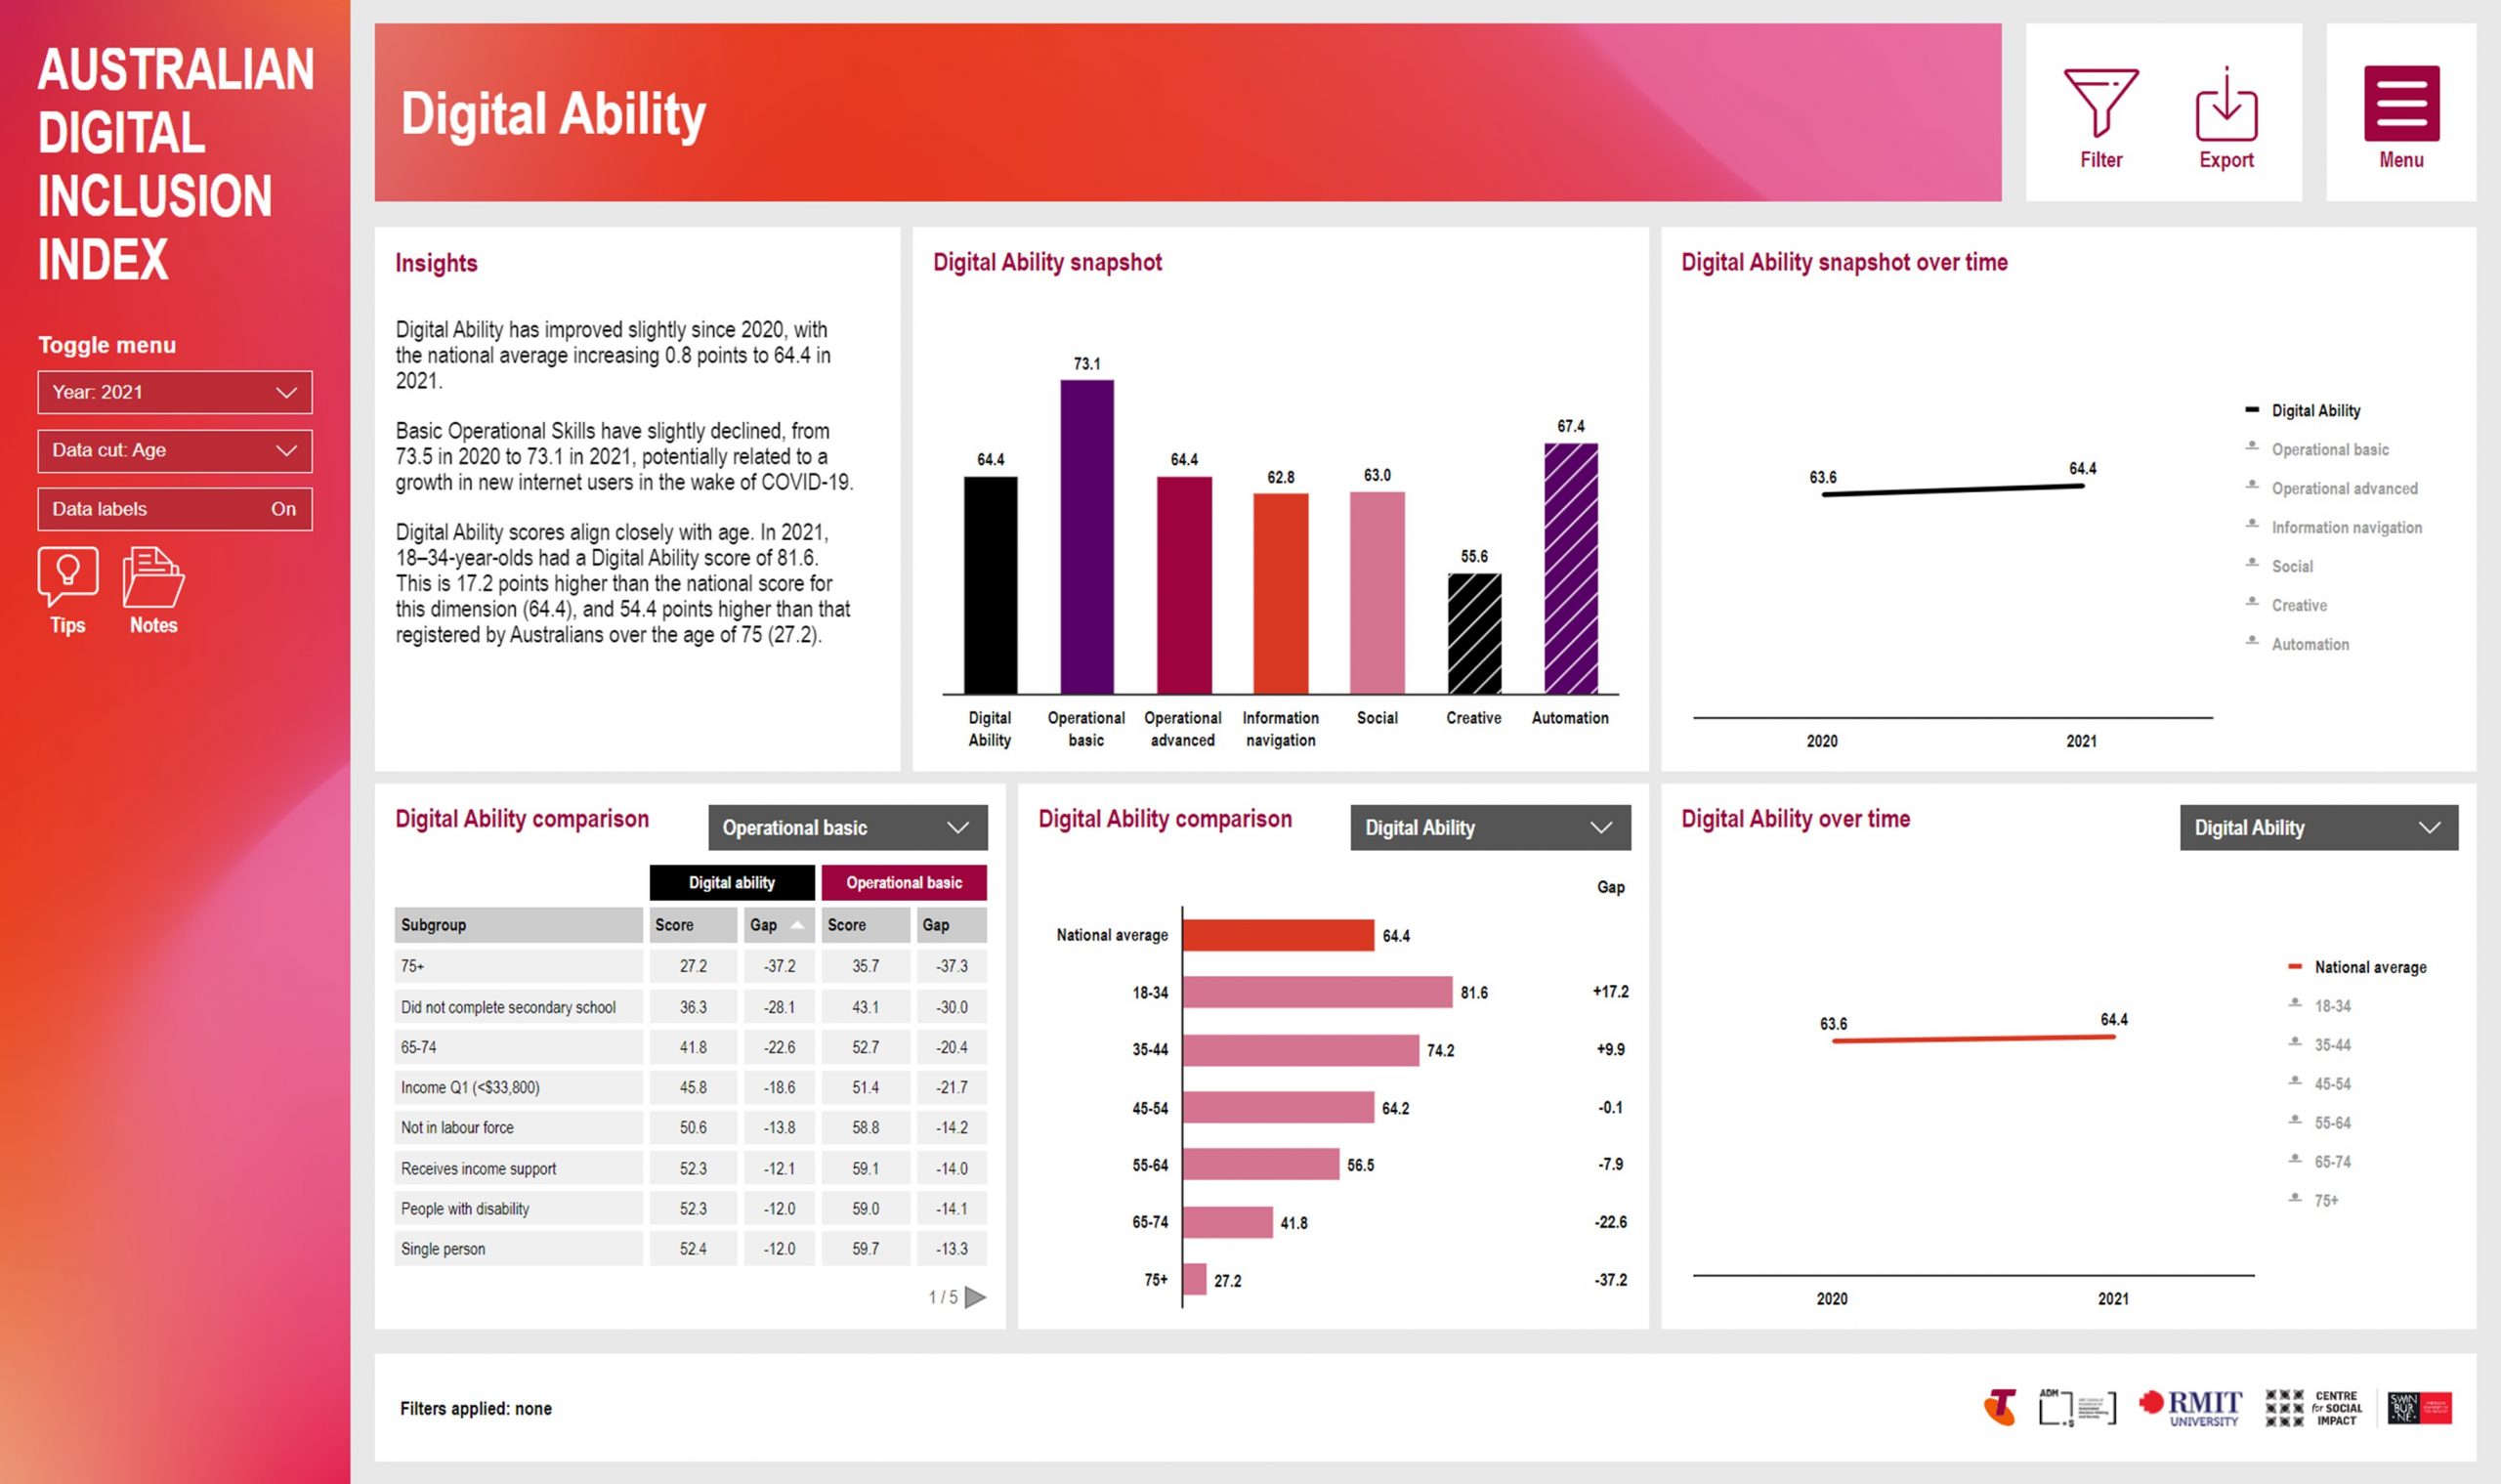
The Australian Digital Inclusion Index (ADII) is a national survey conducted by Centre for Social Impact, ARC Centre For Excellence for Automated Decision-Making and Society, RMIT University, Swinburne University, and Telstra. It measures levels of digital inclusion in Australia to inform policy, decision making, and improve digital inclusion.
The research team Dassier to build a bespoke dashboard reporting platform to allow a diverse range of stakeholders to analyse the data for themselves. The dashboard needed to communicate complex metrics in an accessible, meaningful and insightful way to inform decision making around digital infrastructure and community initiatives.
The ADII dashboard allows users to view, analyse, benchmark, and understand digital inclusion in Australia, and its various drivers including access, affordability, and digital ability. It empowers users to conduct their own longitudinal, geographic, and comparative analysis of these metrics, as well in-depth socio-demographic profiling to identify where initiatives should be prioritised.
End-to-end process
We approach every project in a collaborative way, working closely with you to make sure your feedback is captured at every stage of the process. We can also engage with wider stakeholder teams, clients, and customers to capture feedback and inform the design and build process.
We work with you to understand the problem you are trying to solve, the objectives you are trying to achieve, and the specific inclusions.
We conduct secondary research of other dashboard designs, plan your solution, and develop wireframes, capturing your feedback and incorporating this into the wireframes.
Our graphic designers create visualisations of each page of the dashboard, so you can see what each element and chart will look like, and provide feedback that is then incorporated into the designs. We also create a specification describing how each element of the dashboard will function for end users.
Our analysts work with your internal analytics team or independently to clean, process, and prepare your data files, so that they can be imported into a centralised database.
Once you are happy with the wireframes, graphic design, and functionality specs of the dashboard, we then begin preparing for the build phase. The build phase does not start until you are 100% happy with the dashboard plans.
We build your database from the ground up, deciding on the best architecture based on the type of data you are looking to store. We ensure there is plenty of room to grow with future data, and that we can accommodate additional data files and types that may be added from different sources in future.
Based on the wireframes and graphic design, we build out the user interface from scratch, ensuring we adhere to the plan, and your brand style guide.
Before anything is handed over to you, we go through several rounds of iterative internal testing, ensuring that adjustments are made, and everything is running smoothly.
Sometimes things that look great in a design, don’t work so well when they are built. This is why we release a BETA version, allowing you to test the solution, and circulate to a potential end users for testing as well. This feedback is captured and used to make changes and adjustments, so that everyone is satisfied with the final product.
Once testing is completed, we deploy the live version of the dashboard, monitoring closely, and looking for further improvements that can be made.
Once a dashboard is live, we continue to provide ongoing monitoring and support. You can choose to do data refreshes yourself through an administrator login, or you can leave it to us!
Ongoing support
We provide tailored, flexible and responsive support packages to keep your dashboard running smoothly.
Monitoring and support
Our team monitors the status of your dashboard, identifying issues and rectifying them to minimise disruption. We are always available to provide support.
Changing the dashboard
When reporting needs change, you can either engage us to make changes ad hoc, or purchase an annual 'change hours package' to make changes on the fly.
Fast, easy data refreshes
To refresh your data: upload new files via your admin login, send the files to us and we will refresh the data for you, or we can automate this for efficiency.
Dashboard management
From the admin console, you can manage user access, upload new data files, test changes via the test environment, and publish to the live environment.